
Welcome to Regression Alert, your weekly guide to using regression to predict the future with uncanny accuracy.
For those who are new to the feature, here's the deal: every week, I break down a topic related to regression to the mean. Some weeks, I'll explain what it is, how it works, why you hear so much about it, and how you can harness its power for yourself. In other weeks, I'll give practical examples of regression at work.
In weeks where I'm giving practical examples, I will select a metric to focus on. I'll rank all players in the league according to that metric and separate the top players into Group A and the bottom players into Group B. I will verify that the players in Group A have outscored the players in Group B to that point in the season. And then I will predict that, by the magic of regression, Group B will outscore Group A going forward.
Crucially, I don't get to pick my samples (other than choosing which metric to focus on). If I'm looking at receivers and Ja'Marr Chase is one of the top performers in my sample, then Ja'Marr Chase goes into Group A, and may the fantasy gods show mercy on my predictions.
And then, because predictions are meaningless without accountability, I track and report my results. Here's last year's season-ending recap, which covered the outcome of every prediction made in our eight-year history, giving our top-line record (46-15, a 75% hit rate) and lessons learned along the way.
Our Year to Date
Sometimes, I use this column to explain the concept of regression to the mean. In Week 2, I discussed what it is and what this column's primary goals would be. In Week 3, I explained how we could use regression to predict changes in future performance-- who would improve, who would decline-- without knowing anything about the players themselves. In Week 7, I illustrated how small differences over large samples were more meaningful than large differences over small samples.
Sometimes, I use this column to point out general examples of regression without making specific, testable predictions. In Week 5, I looked at more than a decade worth of evidence showing how strongly early-season performances regressed toward preseason expectations.
Other times, I use this column to make specific predictions. In Week 4, I explained that touchdowns tend to follow yards and predicted that the players with the highest yard-to-touchdown ratios would begin outscoring the players with the lowest. In Week 6, I showed the evidence that yards per carry was predictively useless and predicted the lowest ypc backs would outrush the highest ypc backs going forward. In Week 8, I discussed how most quarterback stats were fairly stable, but interceptions were the major exception.
The Scorecard
| Statistic Being Tracked | Performance Before Prediction | Performance Since Prediction | Weeks Remaining |
|---|---|---|---|
| Yard-to-TD Ratio | Group A averaged 25% more PPG | Group B averaged 12% more PPG | None (Win!) |
| Yards per Carry | Group A averaged 39% more rushing yards per game | Group A averages 33% more rushing yards per game | 1 |
| Interceptions Thrown | Group A threw 69% as many interceptions | Group B has thrown 50% as many interceptions | 3 |
Our yards-per-carry prediction is on life support, especially after a few huge games from Group A backs last weekend. As I said last week, the problem here isn't the yards per carry; Group B has seen its pre-prediction average of 3.39 rise all the way to 4.64 since the prediction. Yards per carry, as noted, is largely random from sample to sample.
The problem instead has been the volume, which is usually quite stable. But Group B has seen its carries per game fall by nearly 25%, and as a result, the ypc improvement hasn't been sufficient to overcome the gap. I know you've seen me question regression in this space only for it to laugh in the face of my doubts, but I think at this point, Group A's lead is too significant to overcome, and this prediction will be our first loss of the year.
Our interception prediction, on the other hand, is going swimmingly. There were five multi-interception games last week, and three came from "low-interception" teams (the Chiefs, Commanders, and Cowboys, who collectively had 9 interceptions in 27 games before throwing six last weekend). Only one came from a "high-interception" team (the Browns), with the fifth coming from a medium-interception squad (the Saints). Overall, our "high interception" teams didn't just throw fewer interceptions in total; they actually averaged fewer per game (0.63 compared to 0.77 from Group A).
Predicting Regression In An Unfamiliar World
I wrote at the beginning of the year that this column has four main goals:
- to persuade you that regression is real and reliable,
- to provide actionable examples to leverage in your fantasy league,
- to educate you on how and why regression is working, and
- to equip you with the tools to find usable examples on your own.
Having (hopefully) made some headway on the first three goals, I want to focus on the fourth.
It's hard enough as a football fan to know whether a "traditional" stat is meaningful or not. ("Meaningful", in this case, means both "correlates with something we actually care about" and "likely to remain stable going forward".) The research on yards per carry has been clear for decades, and I still get pushback when I bring it up.
But we live in a world where new statistics are introduced seemingly every day. There was a time when receiving yards per game was the cutting edge for measuring receiver play. If you really wanted to dig deep, perhaps you'd look into yards per target.
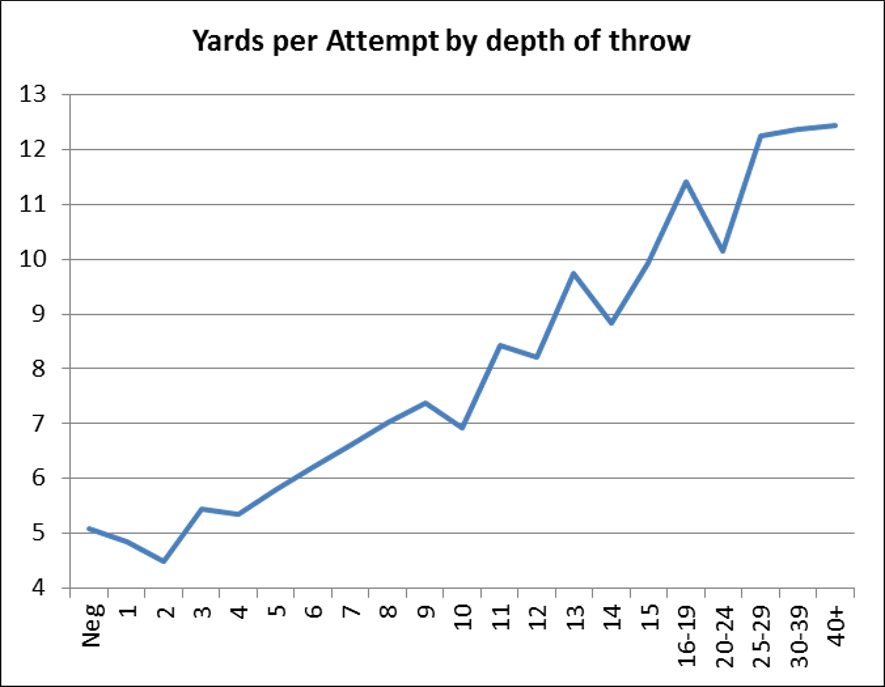
(As a brief aside, yards per target is not a very good efficiency stat. It strongly favors deep threats-- roughly 50% of the variation is explained by a player's yards per reception average. Here is an article from Chase Stuart of Football Perspective illustrating how yards per attempt for quarterbacks-- and by extension, yards per target for receivers-- is largely a function of the depth of the throw.)
After yards per target, people turned to yards per team pass attempt and yards per route run to evaluate receivers. (These are both much better measures of efficiency.) And the options have only further multiplied from there-- fans today who want to know how good a receiver is at getting open can consult NextGenStats' Average Separation, ESPN's Open Score, FantasyPoints Average Separation Score, and Matt Harmon's Reception Perception, just to name four different statistics that purport to measure the same thing but often return wildly divergent results.
In a world where we're inundated with ever-more-complicated statistics all claiming to be the newest and best measure of play-- and especially when those stats frequently find themselves in strong disagreement with each other-- how can anyone be an informed consumer?
I don't have a perfect answer to this. But I do have a quick trick that I use to help sort the wheat from the chaff.