
Quick Links to the League Dominator User Guide
Understanding where your fantasy football team has been is just as important as knowing where it's going. League Dominator provides two tools that help you evaluate past performance and prepare for the rest of the season.
Year So Far allows you to review what players have actually accomplished using your league's specific scoring rules. League Forecast looks ahead, comparing teams across your league and projecting how they might perform over the remaining schedule.
In this guide, we'll walk through both tools, explain their most useful features, and show you how to use them to evaluate your team and plan for the weeks ahead.
Using Year So Far
To get started, open the Menu in League Dominator and select Year So Far.
Unlike Weekly Rankings and Rest-of-Season Rankings, which rely on projections, Year So Far uses actual fantasy points scored during completed games.
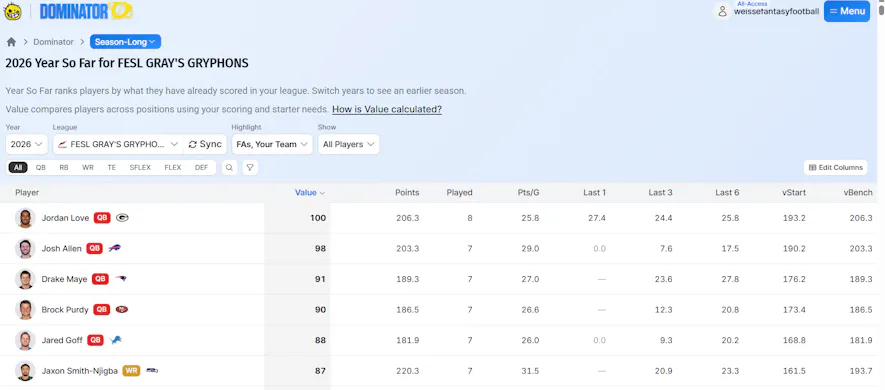
At the top of the page, you can select your league and the season you want to review. You aren't limited to the current season, making this a useful tool for evaluating player performance in previous years.
You can view all positions together or narrow the rankings to a specific position, including QB, RB, WR, TE, and other positions supported by your league.
The rankings include fantasy points scored, games played, points per game, and recent performance. This allows you to compare players based on what they've actually produced rather than what they're expected to do.
Highlighting and Filtering Players
Like Weekly Rankings and Rest-of-Season Rankings, Year So Far includes Highlight and Show dropdowns to help you focus on specific players.
The Highlight dropdown allows you to highlight players on your team, other teams in your league, available free agents, or a combination of these groups.
Changing Show to Highlighted Only removes everyone else from the rankings.
For example, selecting Your Team and Free Agents, then choosing Highlighted Only, allows you to compare your players against available free agents based on their actual production.
This can be particularly helpful when identifying players who have performed well recently but might not be getting much attention.
Understanding Year So Far Value
One of the most useful features of Year So Far is the Value column, which allows you to compare players across different positions.
However, it's important to understand that Year So Far Value is calculated differently from Rest-of-Season Value.
While Rest-of-Season Value evaluates projected production over the remaining schedule, Year So Far Value measures what players have actually contributed during completed games.
The calculation considers your league's scoring rules, positional requirements, and how much better a player has performed compared to typical starters and rostered players at the same position.
Like Rest-of-Season Rankings, Year So Far uses a Value scale from 0 to 100, with the highest-valued player receiving a score of 100.
For a more detailed explanation of the calculation, click How is Value calculated? near the top of the Year So Far page.

Customizing Your Rankings With Edit Columns
Year So Far also allows you to customize the information displayed.
Click Edit Columns in the upper-right corner of the page to select which statistics you want to see.
Available options include:
-
Season Performance: Fantasy points scored, games played, and points per game.
-
Recent Performance: Fantasy points from a player's most recent game, along with their averages over the last three and six games.
-
Positional Value: Value Over a Starter (vStart) and Value Over a Bench Player (vBench), which compare a player's actual production against others at the same position.
You can select individual columns, rearrange their order, or use Select All and Deselect All to customize your view. When you're finished, click Save Changes.
Columns are also sortable, allowing you to organize players by the statistics that matter most to you. On the web version of League Dominator, you can hover over column headings for a brief explanation of each statistic.
Using League Forecast
While Year So Far helps you evaluate what has already happened, League Forecast looks ahead to the remaining fantasy football season.
To access this tool, open the Menu in League Dominator and select League Forecast.

League Forecast uses rest-of-season projections to compare every team in your league, evaluate roster strengths and weaknesses, and project upcoming matchups.
At the top of the page, you can select your league and choose which team you want to evaluate. You can review your own team or select another team to examine a potential opponent or trade partner.
League Forecast organizes its information into three sections: Power Rankings, By Week, and Teams by Pos.
You can scroll through the page to explore each section or click the corresponding tab near the top to jump directly to it.

Power Rankings
The Power Rankings section compares every team in your league based on its projected performance over the remaining season.
Teams are ranked using three important measurements:
-
Start: The projected fantasy points a team's starting lineup will score per remaining week.
-
Bench: How much better a team's bench players are than typical free agents at their respective positions, expressed as an average weekly total.
-
Balance: Measures bench strength across the starting positions those players can fill, with each additional player at a position contributing half as much as the previous player.
If you're using the web version of League Dominator, you can hover over any column heading for a brief explanation of what that measurement represents.
These measurements help you understand more than simply which team has the highest-scoring starters.
For example, a team might have an excellent starting lineup but very little reliable depth. Another team might have slightly weaker starters but a stronger bench that provides more flexibility when injuries or bye weeks occur.
The Balance measurement is particularly useful because it considers how that depth is distributed across positions. Having several quality backups at one position isn't necessarily as valuable as having reliable alternatives throughout your roster.
The comparison bars on the right side of the page show how your selected team compares to the best, average, and worst teams in the league.
Together, these measurements provide a useful snapshot of where your team stands heading into the remainder of the season.
By Week
The By Week section takes League Forecast a step further by examining your remaining matchups individually.
At the top of this section, a chart compares your team's projected weekly scores against your opponents and the league average.
Below the chart, you'll find each remaining matchup, including your projected score and your opponent's projected score.
You can also hover over column headings for additional information about the statistics displayed.
For weeks that have already been completed, the chart also displays win and loss indicators, allowing you to review how your season has progressed.
This section is particularly useful for identifying potentially difficult matchups, spotting favorable stretches of your schedule, and evaluating how your team might perform in the weeks ahead.
Each matchup also includes an Analyze Matchup link, which takes you directly to Matchup Dominator for a more detailed look at that week's matchup.
Teams by Pos
The Teams by Pos section provides a closer look at how every team in your league compares at individual positions.
At the top of the section, radar charts compare the selected team's projected starting lineup and bench strength against the league average.
Below those charts, you'll find rankings for each position, showing how every team compares based on its projected starting lineup production and bench strength.
As with the other sections, hovering over a column heading provides a brief explanation of that statistic.
For example, you might discover that your team has one of the strongest groups of running backs in the league but falls below average at wide receiver.
This information can be particularly valuable when evaluating potential trades. If your team has excellent depth at one position but needs help elsewhere, Teams by Pos can help you identify other teams that might be a good fit for a trade.
You can also switch between teams at the top of League Forecast to examine the strengths and weaknesses of potential trade partners.
Looking Back and Planning Ahead
Year So Far and League Forecast serve different purposes, but together they provide a more complete picture of your fantasy football team.
Year So Far helps you understand what players have accomplished, identify trends in their performance, and compare their actual production using your league's scoring rules.
League Forecast uses projections to show where your team stands against the competition, how your remaining matchups might unfold, and which positions could use additional depth.
Whether you're evaluating your roster, exploring potential trades, or preparing for the fantasy playoffs, these tools can help you make more informed decisions throughout the season.
