
A pair of blockbuster trades (Myles Garrett and A.J. Brown) got June started with a bang. But we are still at a relatively slow point of the calendar when it comes to market-moving dynasty news. So while we will dive into some of the biggest value movers of the last month, now felt like a great time to step back and write about how my dynasty valuation process has been evolving, and how some new workflows are helping me sharpen player values to help you make better-informed trade decisions.
DON'T MISS OUT: Sign up for our free, daily newsletter here.
In June's dynasty trade value article, we'll go in-depth on a number of topics, including:
- My general approach to dynasty valuation and how I am incorporating new data-based sanity checks into specific player values.
- Using actual dynasty trades to quantify and visualize exactly how much the recent off-field news has impacted the trade values of Josh Jacobs and Rashee Rice.
- The specific positional tiers where my dynasty values entering June differed from the trade market (as measured by actual trades), and how I've adjusted to better match it.
- A deeper look at how TE-premium scoring impacts real trades, and why I think most dynasty managers are not playing it correctly.
Adding New Depth to the Dynasty Trade Values
In the slower months of the offseason, I like to focus this article on a bigger-picture topic that has been on my mind. This summer, I'm especially excited about leveraging the trade database I've been building inside the new and improved DTVC tool as another way to make sure the values you see in my work represent the actual market as accurately as possible.
Before getting into the details of that new approach, I want to start with some context about what my dynasty values actually represent and how they have evolved over the years.
The Starting Point
When I first started doing this back in 2014, my method was simple. I projected PPR fantasy points per game for the upcoming season, worked out a positional baseline at each spot (the points per game of a replacement-level QB, RB, WR, and TE), and the gap between the two gave me a clean value for the current season, points per game above replacement, or PPGAR, rounded to the nearest half point. A wide receiver projected for 14.5 PPG against a 10.0 replacement baseline was worth 4.5. Nothing earth-shattering here, just a simplified version of the Value Based Drafting (VBD) principles that smart redraft players had long been using. Then I multiplied that number by a "seasons remaining" estimate to get a starting dynasty value. If a player's current-season value was 4.5 and I thought he had four more years of prime production at about that level, I'd multiply four by 4.5 to get 18, make a few minor adjustments from there, and I had the starting point for a pretty solid dynasty value.
The next layer was context. A 24-year-old quarterback might project to play into his late thirties, but I was never going to multiply his current value by 12, so each position had a maximum number of years I'd use as the multiplier, with a little time-value-of-money discount baked in. The players who took the most hand-tinkering were the ones whose current-year projections were either lower than I thought their future would be (rookies, guys coming off injury) or higher than it (veterans hitting the age curve, or players overly dependent on a great short-term situation).
All these years later, the values you see in this article and in the DTVC tool rest on that same principle and scale: project PPGAR for each season, discount it a little more the further out it sits, and sum it into a projected career value.
Using Range of Outcomes
The process has constantly evolved. One of the first evolutions came when I realized a single baseline projection didn't capture enough context, especially for younger players. What we really care about is the realistic range of outcomes. Luther Burden III currently projects for 14.2 PPG in Jason Wood's Footballguys 2026 preseason projections. In a typical PPR league with a flex or two, that's somewhere in the neighborhood of 4.0 PPGAR. My original approach would have been to multiply that by a single age- and longevity-based multiplier and a discount rate. That's still a solid approach, but what we really want is a number that also captures the full range of outcomes. Amon-Ra St. Brown posted a PPGAR of just over 9.0 last season. Burden reaching that level isn't his most likely outcome, but it isn't far-fetched either, given his skill set and his potential role in the kind of offense that made St. Brown a star. Capturing some of that upside mathematically became a primary focus as the process matured, and it has led me to sit higher than the market on certain young players with a realistic path to stardom (more on this in the wide receiver section below).
Incorporating Redraft ADP and More Sophisticated Data Modeling
Over the last handful of years, I've added new ways to check and refine the values. The explosion of best ball, and the ability to get ADP that updates daily, has been especially helpful. Underdog and DraftKings each run thousands of drafts a day all offseason. When a player's value starts to move there, I know it will soon move in dynasty too. Feed that up-to-the-minute ADP into a model along with age and position, and you get a powerful way to double-check the values and update them as the market moves. I've written about this process in recent offseasons, and I still lean on it today.
Checking Dynasty ADP
Earlier this offseason I wrote about scraping Sleeper for recently completed dynasty drafts and compiling that into accurate dynasty ADP. That data now lives in a tab of the Dynasty Trade Value tool on the site, and it's another way to triangulate accurate values. It has been especially useful because, on top of fresh data, cataloging the scoring and starting-roster requirements of each league lets me clean and adjust what the ADP is signaling for specific formats.
Using Actual Recent Dynasty Trades to Calibrate the Values
All of that brings us to today, and the new check I'm folding into the valuation process. As someone in dozens of dynasty leagues who has always tracked the trades in my leagues and followed the trade talk in the Shark Pool, completed dynasty trades have always factored into how I update values. But that has been anecdotal, not analytical. That is changing.
Back in March, I started building a database of real dynasty trades pulled from active Sleeper leagues. As of June 1st it's nearing 90,000 trades over the last four months, and growing by roughly 400 a day. Along with the details of each trade, I capture each league's settings (scoring, starting roster, and so on). Armed with that, and some data-manipulation work, I have a new way to read the exact market value of a player at a given moment. The rest of this article is about that process, and how I'm using it to calibrate my values, both for individual players and for the positional tiers where I've drifted too high or too low against how people are actually trading.
Trade Value ELO
The idea is simple. I want to look at real trades and see if my current trade values actually reflect where the market is at. Using real trades is powerful because at least two individual dynasty managers viewed the two sides as about equal. If I grade that same trade with my own values and one side comes out clearly ahead, the market is telling me I disagree with it about somebody in the deal. Any single trade is noise. But run it across thousands of them and the random disagreements wash out, while the ones that don't, the players whose side keeps coming out ahead or behind by my numbers, are the players I've got mispriced.
In practice it's three steps. First, grade every trade: add up my superflex values on each side, players from my chart and picks from my pick values, and the difference is how lopsided the deal looks through my eyes. Second, turn those grades into a verdict for each player. I start everyone at my current value and walk through the trades one at a time. Each time my numbers say a side came out ahead, I nudge that side's players down a touch and the other side's up, splitting the difference between them. Loop over the whole pile until it settles, then anchor everything back toward my starting values so a player with three trades barely moves while one with forty gets a real say. The more the market actually transacts a player, the more of a vote it earns. Third, read the gaps: where the market lands minus where I have him. A big positive means the market is paying more than I am. A big negative means I'm the high one.
I used some data filters to keep the data as clean as possible. I graded superflex, full-PPR leagues only, because I wanted to test only against my base values, which are based on that format. I stick to normal league sizes, ten to fourteen teams, since the deep leagues run on a different scale and the pick math stops meaning the same thing. I cap a trade at six total assets, because the giant blockbusters are noisy and hard to read. I throw out any deal my own values grade as wildly lopsided, on the theory that a fair trade is the whole premise and a fifty-point blowout is either a dump or bad data (sometimes dispersal drafts present as trades). And, importantly, I grade only zero-TE-premium leagues, for a reason I'll come back to at the end of this article.
Before diving into the position-by-position calibration, let's look at what the trade data is telling us about the market values of the two players whose values moved the most in May.
Josh Jacobs
Last week, news broke that Josh Jacobs was facing accusations of domestic abuse. Footballguys' Drew Davenport has been all over the case and I will leave the legal analysis to him. Instead, I will focus on exactly how the dynasty trade market has reacted to the news.
I pulled every trade since May 1st in which Jacobs was the only player going one way, so that whatever came back the other way is, by definition, what the market was paying for him. Before the news, he was changing hands at about a 16 in my values. After, those same lone-asset deals settle right around 10, and we can see the delineation in the chart below:
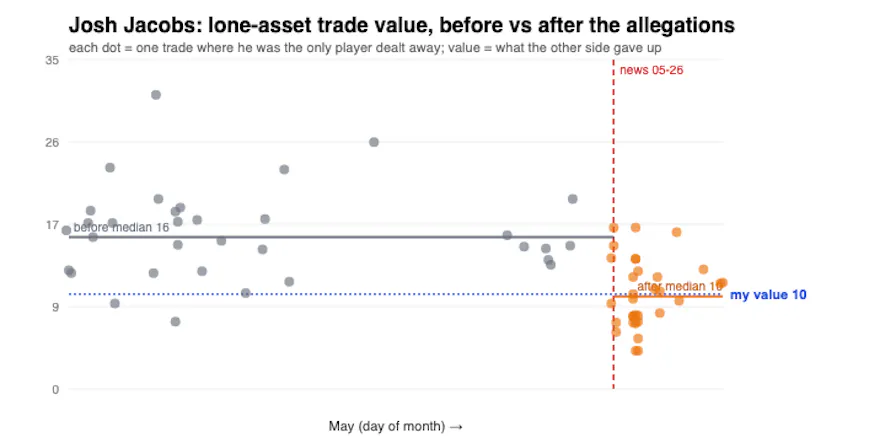
That's a drop of about 40%. I initially dropped Jacobs' value to 9.0 on the news. Based on the trade-value calibration, I will bump him back up just slightly to 10.0.
Rashee Rice
We can do the same analysis on Rashee Rice. He was sentenced to 30 days in jail on May 19th, after which his value dropped to 17.5:
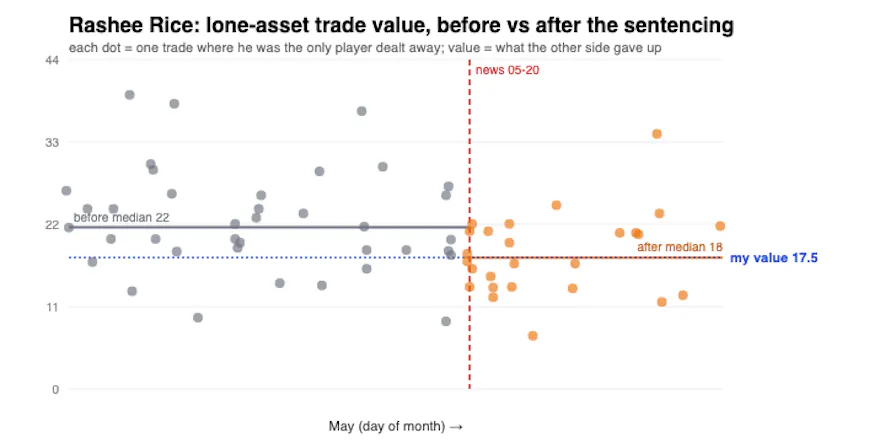
This time, I lagged the market by only dropping his value to 20.5. So this is one I'm acting on directly and I'm dropping Rice the rest of the way, to 17.5, to more accurately reflect where the market is really at on him.
Where I Was Off, and by How Much
Once I was finally comparing apples to apples, the encouraging headline was that there was no glaring positional bias. Averaged across a whole position, my values and the market mostly agreed, which is about the best outcome I could ask for from a chart I maintain by hand. The leans that did show up were individual players and one soft tier-level pattern, and a couple of them were big enough to act on.
I am going to document the value changes I made here for individual players based on these minor recalibrations, as opposed to doing so in the change log in the DTVC tool, because the change log is primarily meant to document value changes based on player news as opposed to these regular calibrations I do to get more in line with the market.
Quarterbacks
When testing my values against the implied values from the market, everything points the same direction: I'm a small step high on the middle of the position while the market is a touch hotter than me on the very top.
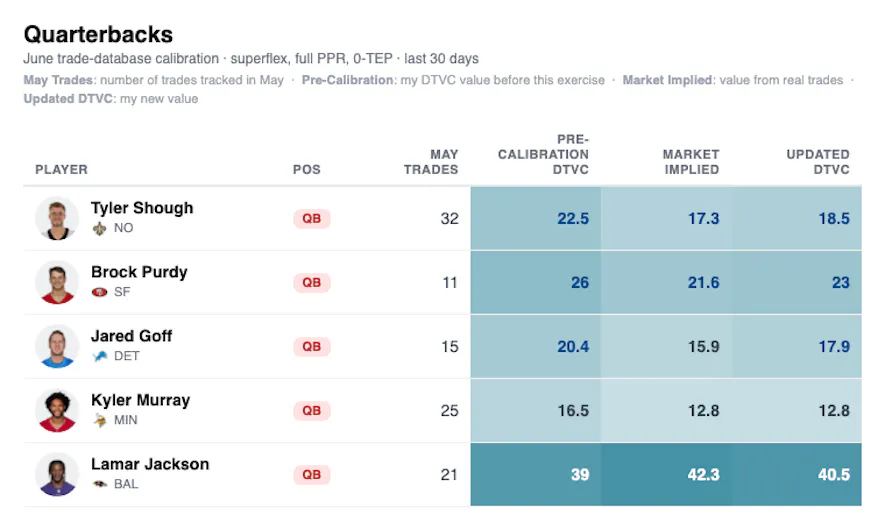
Tyler Shough: I am okay with being slightly above market on Shough, but a gap of 5.2 is way too much. I put my finger on the scales a little bit at times, but I want the values in the tool to mostly just reflect back actual market value. Dropping him all the way down to 18.5 to align with where the market is valuing him.
Brock Purdy: This is a spot where my bias might be showing. I love Purdy as a long-term starter in an elite offense. I think the market probably underestimates his rushing upside, as well. Still, this is too large a gap to justify, and the calibration will reduce his value to 23. I view Purdy as a strong "buy" at this type of valuation.
Jared Goff: I absolutely love having a safe, high-end QB2 like Goff in superflex leagues. My research strongly points to quarterbacks who score nearly all of their fantasy points with their arms (Matthew Stafford, Tom Brady, Drew Brees, etc.) maintaining high fantasy production for much longer than quarterbacks who are more reliant on athleticism. Thus, I do not discount Goff because of age, as the market may be. I will calibrate his value down to 17.9. As with Purdy, if you can add Goff for ~16 points worth of value, he is a "buy."
Kyler Murray: I am intrigued with Murray's upside, but must acknowledge the real possibility he is not the long-term answer in Minnesota. I am going to drop his value to exactly match where the trade market is currently at (12.8), though I suspect he will see his value rise over the coming months as he inevitably locks down the starting job for 2026 in a fun fantasy offense.
Lamar Jackson: I'll split the difference and bump Jackson up slightly. I've already written about Jackson in recent months and won't rehash the argument, but I'll simply note that I worry about his ability to put up difference-making fantasy numbers as age naturally saps his athleticism in the coming seasons.
Running Backs
Continue reading this content with a ELITE subscription.
An ELITE subscription is required to access content for Dynasty leagues. If this league is not a Dynasty league, you can edit your leagues here.